This free indicator automatically draws MT5 support resistance zones from ZigZag pivot clusters — and it's fully open-source. No compiled black box. Full MQL5 source on GitHub, MIT licence, dual fast/slow ZigZag lines, and ATR-adaptive zones drawn as colour-filled rectangles directly on the chart.
 1")
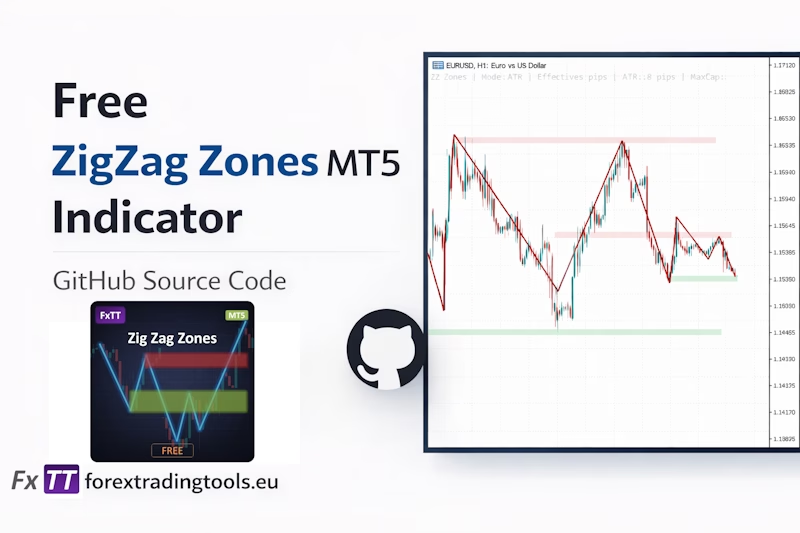
Automatic MT5 support resistance zones reacting to price
ZigZag is one of the oldest swing-detection tools in technical analysis. The problem with most implementations is that they give you a line and nothing else. You see the swings — but you don't see where price has repeatedly stalled, reversed, or found energy.
This indicator adds that missing layer. It clusters ZigZag pivot points into support and resistance zones and keeps the zone height calibrated to current volatility via ATR.
What are ZigZag-based MT5 support resistance zones?
A ZigZag pivot is a confirmed swing high or swing low. Each one marks a price level where a meaningful reversal occurred. If multiple pivots cluster around the same level across different swings, that level has been tested repeatedly — which is exactly what makes these zones reliable.
The classic approach is to draw horizontal lines by hand. This indicator automates it: it scans all ZigZag pivots within a configurable lookback, groups the ones that fall within a defined price tolerance, and draws a rectangle around each cluster.
The result is a live, self-updating map of the levels where price has historically reacted — recalculated on every bar.
How the indicator draws MT5 support resistance zones
Two ZigZag lines. Two sets of zones. One indicator.
Dual independent ZigZag lines
The fast ZigZag uses tighter settings to catch shorter-term structure. The slow ZigZag uses wider settings for the larger swings. Both lines are rendered simultaneously with full visual control — colour, width, and visibility are independent inputs for each.
The default configuration is Fast=(6,5,3) and Slow=(12,8,6) — depth, deviation in pips, backstep. You change them independently without either line affecting the other.
ATR-adaptive zone height
Zone height is the tolerance used to group pivots into a cluster. A fixed pip value works on a single instrument and timeframe — but it breaks when you move to volatile pairs or longer-period charts.
When InpUseAtrZoneHeight = true, the indicator reads the current ATR and scales the zone height accordingly:
double atrPips     = atrBuffer[0] / ZZPipSize();
double dynamicPips = atrPips * InpAtrMultiplier;  // default 0.35
dynamicPips = MathMax(dynamicPips, InpAtrMinZonePips);
dynamicPips = MathMin(dynamicPips, maxCapPips);   // capped by ATR * MaxCapMultiplier
The cap itself is also ATR-driven by default (InpUseDynamicAtrMaxCap), so zone height stays proportional as volatility regimes change. The diagnostics label on screen shows the live effective height so you always know what the indicator is using.
Auto-widen fallback
In low-volatility conditions or when the lookback is short, there may not be enough pivot clusters that meet the minimum touch count. The InpAutoZoneHeight option handles this by progressively widening the zone tolerance — up to InpMaxZoneHeightMult × zoneHalf — until at least one drawable zone appears.
Configurable zone rendering
- Up to 5 resistance zones and 5 support zones (configurable)
- Minimum slow pivot count per zone — filters weak clusters
- Optional fast pivot inclusion for denser zone confirmation
- Broken zone display — show zones already violated by price
- Extend-right option — zones project to the right edge of the chart
- Fill opacity control (0–255 alpha) via
ColorToARGB() - Independent resistance and support colours
Implementation details for MQL5 developers
The indicator is split into two files: the main .mq5 entry point and a zig-zag-zones-core.mqh header that handles all calculation and drawing. The design is deliberately modular — the core can be included in other indicators or EAs to add MT5 support resistance zones to any project with no changes.
DRAW_COLOR_ZIGZAG with six buffers
Each ZigZag line uses three indicator buffers: peak, trough, and colour index. With two lines, that is six buffers total. The colour buffer drives the segment colouring — 0.0 for an upward segment, 1.0 for downward — which lets you use distinct colours for rising and falling legs without any custom drawing code:
// Bind six buffers for two DRAW_COLOR_ZIGZAG plots
ZZBindBuffers(0, g_fastPeakBuffer, g_fastBottomBuffer, g_fastColorBuffer);
ZZBindBuffers(3, g_slowPeakBuffer, g_slowBottomBuffer, g_slowColorBuffer);

// ZZBindBuffers internals:
SetIndexBuffer(baseIndex,     peakBuffer,   INDICATOR_DATA);
SetIndexBuffer(baseIndex + 1, bottomBuffer, INDICATOR_DATA);
SetIndexBuffer(baseIndex + 2, colorBuffer,  INDICATOR_COLOR_INDEX);
ArraySetAsSeries(peakBuffer,   true);
ArraySetAsSeries(bottomBuffer, true);
ArraySetAsSeries(colorBuffer,  true);
Plot colours are applied at runtime via PlotIndexSetInteger() rather than relying solely on #property indicator_color — which means input-driven colour changes take effect without reloading the indicator.
The zone clustering algorithm
Zone building is a single-pass greedy clustering loop. Each pivot is tested against all existing zone centres. If the distance to a centre is within zoneHalf × 2, the pivot is merged into that zone; otherwise a new zone is created. No k-means, no sorting required up front:
for(int pivotIndex = 0; pivotIndex < pivotCount; pivotIndex++)
{
   bool merged = false;
   for(int zoneIndex = 0; zoneIndex < zoneCount; zoneIndex++)
   {
      if(MathAbs(pivots[pivotIndex].price - zones[zoneIndex].Center()) <= effectiveZoneHalf * 2.0)
      {
         zones[zoneIndex].priceSum += pivots[pivotIndex].price;
         zones[zoneIndex].touches++;
         merged = true;
         break;
      }
   }
   if(!merged)
      zones[zoneCount++] = newZoneFrom(pivots[pivotIndex]);
}
Center() is a running average: priceSum / touches. Because the centre drifts as more pivots are merged, a pivot rejected in the first pass might have been accepted if the centre had already shifted. For the zone sizes used in practice this is a non-issue — and the algorithm is O(n×m), fast enough for any realistic lookback on a 300-bar window.
MT5 support resistance zones sorted by proximity to price
After clustering, zones are bubble-sorted so the closest ones to current price are drawn first. When maxZones = 5, you get the five most relevant levels — not the five oldest. The sort key is MathAbs(zones[i].Center() - currentPrice).
Broken zone detection
A zone is marked broken if current price has moved cleanly through it: above priceHigh for resistance, below priceLow for support. The showBroken flag controls whether they are drawn at all. Broken zones are rendered with a dotted border (STYLE_DOT) as a visual distinction.
3- vs 5-digit broker handling
All pip-based inputs are normalised through a single helper that you can reuse in your own MQL5 code:
double ZZPipSize()
{
   return (_Digits == 3 || _Digits == 5) ? _Point * 10.0 : _Point;
}
Every deviation value, zone half-width, and ATR conversion goes through ZZPipSize(). One function call keeps the entire indicator broker-agnostic.
Dual ZigZag pivot collection
Zones are primarily built from slow ZigZag pivots. When InpIncludeFastPivots = true, fast pivots are added to the same pool and tagged with a ZZ_PIVOT_SOURCE_FAST enum value. The minimum fast pivot count (InpMinFastZonePivots) then acts as an additional qualifier — a zone can require confirmation from both time horizons before it is drawn.
Why I open-sourced this indicator
When you download a compiled .ex5 file, you are running code you cannot read.
Most people don't think about that. They install, they use, they move on. But if I were on the other side, I'd want to know exactly what I'm running on my trading terminal — especially an indicator drawing MT5 support resistance zones I'm making decisions around.
Opening the source is the simplest answer. Here's the code. Read it. Compile it yourself if you want. You don't have to trust me.
The core header (zig-zag-zones-core.mqh) is structured specifically to be included in other MQL5 projects. Drop it into your include path and call ZZRedrawZones() from your own indicator or EA's OnCalculate(). The indicator entry point is a thin wrapper around exactly those calls.
How to install the MT5 support resistance zones indicator
- Download the
.zipfrom the GitHub releases page - In MT5: File → Open Data Folder
- Extract both files (
fxtt-zig-zag-zones-mt5.mq5andzig-zag-zones-core.mqh) toMQL5/Indicators/ - Open
fxtt-zig-zag-zones-mt5.mq5in MetaEditor and press F7 to compile - Restart MT5 or right-click Navigator → Refresh
- Drag fxtt-zig-zag-zones-mt5 onto any chart
Prefer the pre-compiled file? The repository releases page includes the compiled .ex5 so you can install without MetaEditor.
How to trade with MT5 support resistance zones
I use the slow ZigZag zones as the structural read. If price is approaching a slow resistance zone, I look for rejection setups. If it breaks through cleanly and comes back to retest from above, that is a support zone forming in real time.
The fast ZigZag handles entry context. A fast pivot forming inside a slow zone tells me the market is finding the level relevant at the shorter timeframe too. The dual confirmation reduces noise without requiring a second indicator loaded separately.
I keep InpMinSlowZonePivots = 2 as the default because a single touch is not a zone — it is just a line. Two or more slow pivots clustering at the same level is what makes a level worth watching.
The extend-right option is particularly useful during live trading. With zones extending to the right edge, you get an immediate visual read on which levels are currently active without having to interpret where old rectangles end.
Frequently asked questions
Is this MT5 support resistance zones indicator really free?
Yes — free to download, free to use, free to modify. MIT licence. No subscription, no trial, no catch.
Do the zones repaint?
ZigZag by definition extends the most recent segment until a reversal is confirmed — the last unconfirmed pivot will move as new bars come in. That is standard ZigZag behaviour, not a bug. All confirmed pivots are fixed. Zones are built exclusively from confirmed pivots and do not change once drawn unless a new pivot qualifies or an existing one is displaced.
What is the difference between the fast and slow ZigZag zones?
The fast ZigZag (default depth=6, deviation=5, backstep=3) reacts quickly and catches minor swing points. The slow ZigZag (default depth=12, deviation=8, backstep=6) filters those out and shows only higher-magnitude structural swings. Zones are driven primarily by the slow line — the fast line is optional enrichment.
Can I embed the zone logic in my own EA?
Yes. The zone calculation lives entirely in zig-zag-zones-core.mqh. Include it, construct a CZigZagLine, populate a SZZZoneSettings struct, and call ZZRedrawZones(). The indicator entry point is a thin wrapper around exactly those calls.
Does it work on all MT5 symbols and timeframes?
Yes. ATR-based zone height scales automatically across instruments and timeframes. The ZZPipSize() helper handles both standard and 5-digit brokers. Tested on forex pairs, indices, and gold.
Why are no zones showing on my chart?
The most common reason is that InpMinSlowZonePivots is set higher than the number of qualifying slow pivots in the current lookback window. Try reducing InpMinSlowZonePivots to 1, increasing InpZoneLookback, or enabling InpAutoZoneHeight — which widens the tolerance automatically until qualifying zones appear. The diagnostics label at the top-left of the chart tells you exactly what height the indicator is currently using.
Download the free MT5 support resistance zones indicator
Free to download, free to use, free to modify.
If you find a bug or want to contribute — open an issue on GitHub. I read them.
— Carlos