MTF Bollinger Bands MT5 – Multi-Timeframe Panel for MT5

Version 1.10
March, 2026
Download the MTF Bollinger Bands indicator for MT5 free and view up to 9 Bollinger Band timeframes on one MetaTrader 5 chart. Instantly toggle each timeframe from a draggable panel to analyse volatility, Bollinger Band squeezes, confluence zones, and dynamic support and resistance — without switching charts.
MTF Bollinger Bands MT5 is a free multi-timeframe Bollinger Bands indicator for MetaTrader 5 that displays Bollinger Bands from up to nine timeframes simultaneously on a single chart. Instead of switching between charts to check higher-timeframe volatility and structure, you can keep the full market context visible on your execution chart and toggle each timeframe instantly from a draggable control panel.
This MT5 Bollinger Bands indicator is built for traders who want to identify volatility expansion, Bollinger Band squeezes, volatility contraction, multi-timeframe confluence zones, dynamic support and resistance, and higher-timeframe context — all without cluttering their workflow.
New to the platform? Visit the official MetaTrader 5 website to learn more about MT5, and read a general explanation of Bollinger Bands if you want a quick refresher on how the indicator works.
If you also use MT4, see our MTF Bollinger Bands – Free Indicator. You may also like our MTF Triple Moving Averages – Free Indicator and our guide on how to backtest forex strategies in MT5.
What Is the MTF Bollinger Bands Indicator for MT5?
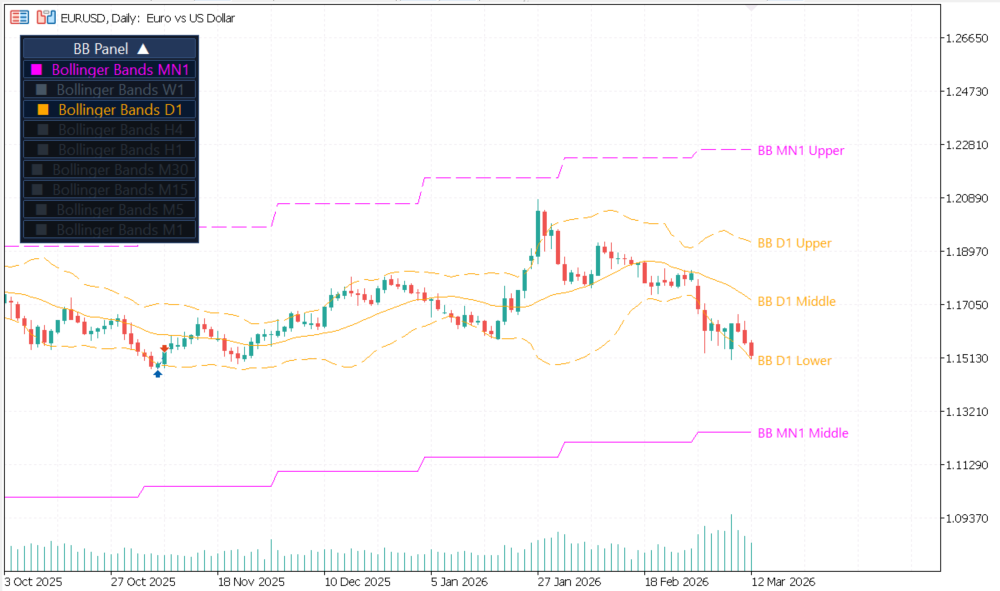
The MTF Bollinger Bands MT5 indicator calculates Bollinger Bands independently for each supported timeframe and projects them onto your active chart. Each timeframe uses a unique color so you can instantly distinguish monthly, weekly, daily, and intraday Bollinger Bands without changing charts.
This makes it easier to see where price is trading relative to higher-timeframe bands, which helps with timing entries, exits, stop placement, and volatility-based trade management. Traders use it to spot Bollinger Band squeezes across multiple timeframes, confirm breakouts with higher-timeframe BB width expansion, and identify when price is approaching a key multi-timeframe band level.
Multi-Timeframe Bollinger Bands on One MetaTrader 5 Chart
The indicator supports all standard MetaTrader 5 timeframes:
- MN1 – Monthly
- W1 – Weekly
- D1 – Daily
- H4 – 4 Hour
- H1 – 1 Hour
- M30
- M15
- M5
- M1
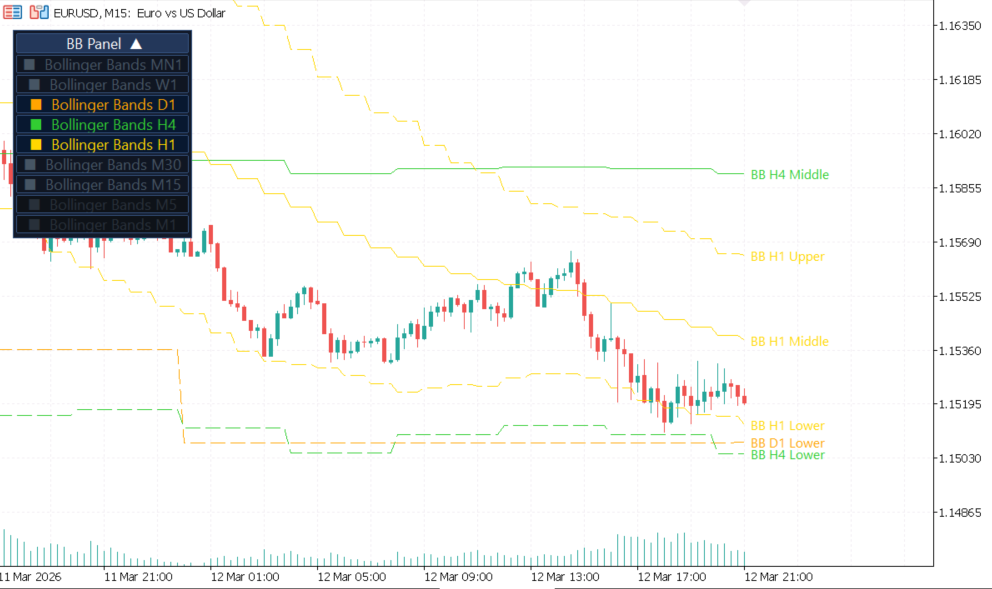
Timeframes below the current chart timeframe are automatically disabled to keep the display relevant and reduce visual noise.
MTF Bollinger Bands MT5 Indicator Features
- Nine timeframes in one chart. Visualize higher and lower timeframe Bollinger Bands together for complete multi-timeframe analysis.
- Color-coded bands. Identify each timeframe instantly — no guesswork about which band belongs to which timeframe.
- Right-side price labels. Read the upper, middle, and lower Bollinger Band values directly on the chart edge.
- Draggable control panel. Move the panel anywhere and collapse it when you need more chart space.
- One-click timeframe toggles. Show or hide any timeframe instantly during live trading.
- Automatic timeframe filtering. Lower timeframes than the current chart are disabled automatically.
- Session memory. Your panel position and visibility settings are restored when the chart reloads.
- No repainting. Completed band values are fixed and never change retroactively.
Why Traders Use This Free MT5 Bollinger Bands Indicator
- Spot multi-timeframe confluence where several Bollinger Bands align near the same price level.
- Identify Bollinger Band squeezes forming simultaneously across multiple timeframes — often a precursor to large moves.
- Confirm whether a lower-timeframe breakout is supported by higher-timeframe BB width expansion.
- See whether the market is compressing or expanding across different timeframes at a glance.
- Reduce chart switching while keeping the higher-timeframe volatility context visible at all times.
- Improve timing for entries, exits, and pullback trades using dynamic higher-timeframe band levels as reference.
- Use the middle band (20 SMA) across timeframes as a dynamic trend filter for your trading system.
Bollinger Bands Settings
The indicator uses the standard Bollinger Bands parameters across all active timeframes:
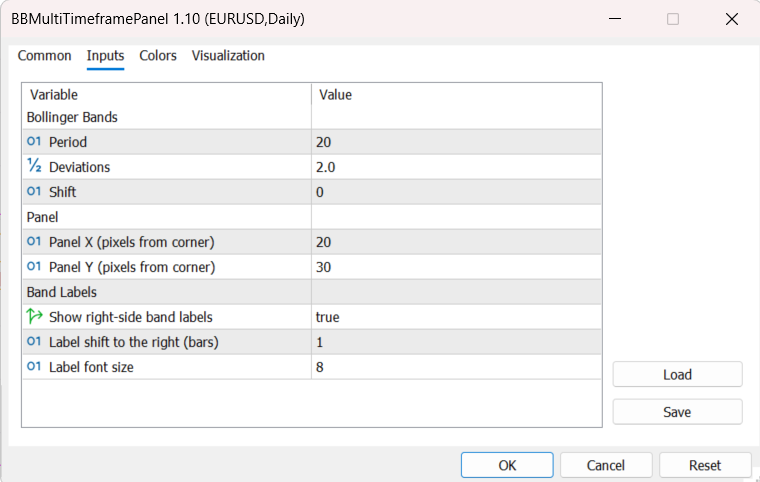
- Period – moving average period, default 20
- Deviations – standard deviation multiplier, default 2.0
- Shift – horizontal band displacement
Additional display controls let you manage panel position, label visibility, label offset, and font sizing. All settings are applied uniformly across every active timeframe, so your Bollinger Bands analysis remains consistent when comparing timeframes.
How to Install and Use the MTF Bollinger Bands Indicator for MT5
- Download the free indicator package using the button on this page.
- Copy the indicator file into your MetaTrader 5 / MQL5 / Indicators folder.
- Restart MetaTrader 5 or right-click the Navigator panel and select Refresh.
- Attach the indicator to any chart by double-clicking it in the Navigator.
- Use the control panel to enable or disable individual timeframes.
- Drag the panel to your preferred chart position and collapse it if needed.
- Monitor confluence zones, higher-timeframe band reactions, BB squeezes, and volatility changes in real time.
MTF Bollinger Bands MT5 vs Standard Bollinger Bands
The built-in Bollinger Bands tool in MT5 only shows one timeframe at a time. This multi-timeframe Bollinger Bands indicator extends that concept by displaying up to nine timeframes together on a single chart, which helps traders interpret volatility, BB width, and structure with far more context.
For traders who want a broader multi-timeframe workflow, combining this indicator with tools like our MTF Triple Moving Averages can help you align volatility (via Bollinger Bands) and trend direction (via moving averages) more effectively on a single chart.
Compatibility
Platform: MetaTrader 5
Instruments: Forex, gold, indices, crypto, and all MT5-supported symbols
Timeframes: M1 to MN1
Works with: Manual trading, visual analysis, EAs running on separate charts
FAQ
What is the MTF Bollinger Bands indicator for MT5?
It is a free multi-timeframe Bollinger Bands indicator for MetaTrader 5 that displays Bollinger Bands from up to nine timeframes simultaneously on one chart, with a draggable control panel for toggling each timeframe on or off.
Is this indicator free to download?
Yes. The MTF Bollinger Bands MT5 indicator is completely free to download and use. Simply click the download button on this page and install it in your MT5 platform.
How do I install the MTF Bollinger Bands indicator in MT5?
Download the zip file, extract the .ex5 file, and copy it into your MQL5/Indicators folder (File → Open Data Folder → MQL5 → Indicators). Restart MT5 or refresh the Navigator, then drag the indicator onto any chart.
Can I hide specific timeframes?
Yes. Each timeframe can be enabled or disabled individually from the draggable control panel directly on your chart.
Does the indicator repaint?
No. The bands are calculated from historical timeframe data and completed values do not change. There is no repainting on closed bars.
What is a Bollinger Band squeeze and can this indicator detect it?
A Bollinger Band squeeze occurs when the bands narrow significantly, indicating low volatility that often precedes a large price move. By displaying multiple timeframes at once, this indicator makes it easy to spot when a squeeze is developing across several timeframes simultaneously — a stronger signal than a single-timeframe squeeze alone.
Can I use it on forex, gold, indices, and crypto?
Yes. The indicator works on any instrument available in your MetaTrader 5 terminal, including forex pairs, gold (XAUUSD), stock indices, and cryptocurrencies.
Does it work on a VPS or with Expert Advisors?
Yes. The indicator loads and runs normally on a VPS. It does not interfere with Expert Advisors running on the same or different charts, as it is a visual indicator only.
Is there an MT4 version?
Yes. MT4 users should use the MTF Bollinger Bands – Free Indicator version instead. This MT5 version is designed specifically for MetaTrader 5.
Installing MTF Bollinger Bands MT5
- Download the ZIP package from this product page.
- Extract the archive and locate the
.ex5indicator file. - In MetaTrader 5, open File -> Open Data Folder.
- Go to
MQL5/Indicatorsand copy the extracted indicator file there. - Restart MT5 or right-click the Navigator and choose Refresh.
- Drag MTF Bollinger Bands MT5 onto any chart.
- Choose the Bollinger period, deviation, panel position, and which timeframe bands you want visible.
Tip: Save your preferred setup as a chart template so you can reuse the same multi-timeframe layout on other symbols in seconds.
Settings Reference
| Parameter | Default | Description |
|---|---|---|
InpPeriod | 20 | Bollinger Bands period used on every enabled timeframe. |
InpDeviations | 2.0 | Standard deviation multiplier for the upper and lower bands. |
InpBBShift | 0 | Horizontal shift applied to the Bollinger Bands calculation. |
InpPanelX | 20 | Horizontal panel position in pixels. |
InpPanelY | 30 | Vertical panel position in pixels. |
InpShowBandLabels | true | Show or hide right-side labels for the upper, middle, and lower bands. |
InpLabelShiftBars | 1 | How far to the right the band labels are shifted. |
InpLabelFontSize | 8 | Font size used for the band labels. |
The on-chart panel lets you toggle Bollinger Bands for MN1, W1, D1, H4, H1, M30, M15, M5, and M1. Timeframes lower than the current chart are automatically disabled to keep the display clean and relevant.
v1.10 2023-12-09
- Initial public release of MTF Bollinger Bands.
- Added multi-timeframe Bollinger Bands projection from MN1 down to M1.
- Added on-chart toggle panel for fast timeframe visibility changes.
- Added upper, middle, and lower band labels with configurable font size and shift.
Images Gallery
mtf-bollinger-bands-mt5-confluence-01
mtf-bollinger-bands-mt5-confluence
mtf-bollinger-bands-mt5-settings-01
mtf-bollinger-bands-mt5-settings
mtf-bollinger-bands-mt5-01
mtf-bollinger-bands-mt5

Reviews
There are no reviews yet.